The context
Hospital San Juan de Dios (HSJD) is one of Chile's largest public hospitals, serving a high-complexity patient population in Santiago. The emergency department — called SUAO — was operating under chronic overcrowding, with no patient flow separation and wait times well beyond clinical safety thresholds.
The project came through the Centro de Sistemas Públicos (CSP) at Universidad de Chile, where I worked under Prof. Óscar Barros — my thesis advisor in the MBE program. I was brought in specifically because of my background at the intersection of health systems and process design: the team needed someone who could read clinical environments and translate what they saw into systems language.
The mandate was open-ended: diagnose what was broken in the emergency service and design a solution. There was no predefined answer.
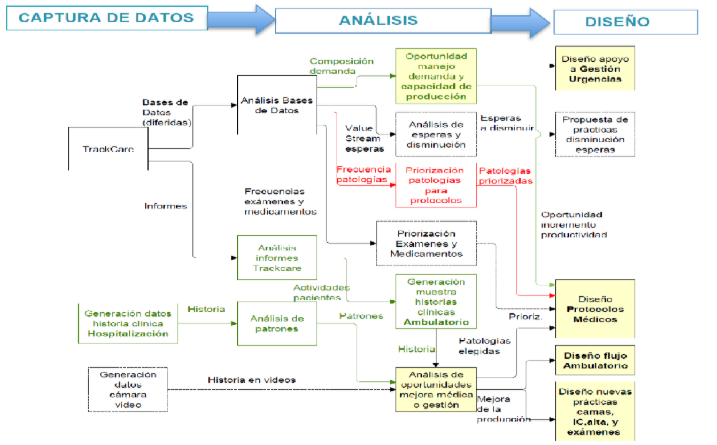
Discovery: going to the floor
This project did not start at a desk. The discovery phase was built around direct observation at HSJD — during winter campaign peaks, when the department was at maximum stress. I went to the hospital repeatedly, timed patient flows manually, drew process maps of how patients actually moved through the space, and analyzed footage from security cameras to measure box occupancy.
That last method matters: when the data system (TrakCare) couldn't tell us how long boxes were physically occupied versus administratively occupied, we went to the camera footage. The gap between those two numbers was itself a finding.
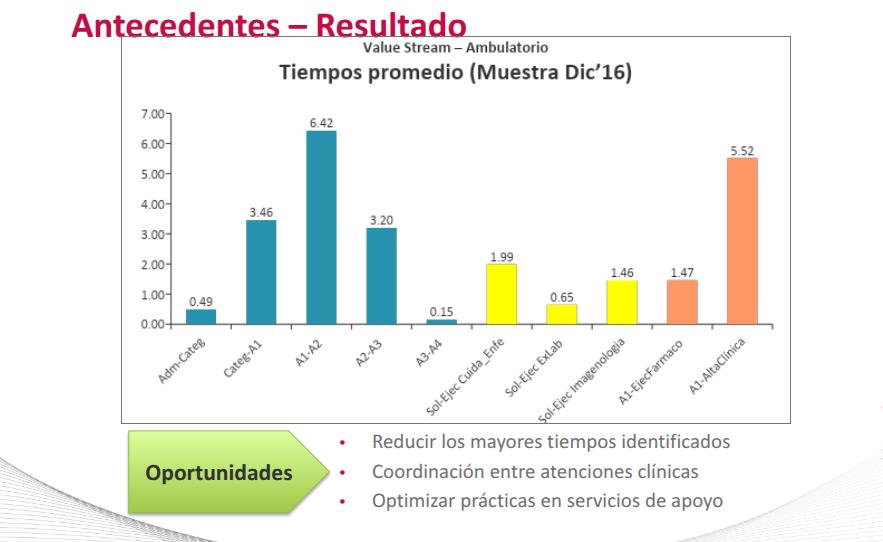
What the data showed
| Flow stage | Avg time | Finding |
|---|---|---|
| A1 → A2 (clinical attention to results) | 6.42 hours | Primary bottleneck — largest single gap |
| A1 → Discharge | 5.52 hours | Coordination failure at exit |
| Total time in system | 7.3–11.7 hours | Varies by patient category |
| Bed-days with waiting records | 44.1% | Beds blocked by coordination, not clinical need |
The real problem
The surface complaint was overcrowding. The actual problem was systemic coordination failure between units. Boxes were being blocked while patients waited for lab results — so the waiting room had effectively moved inside the emergency department. M2 (very urgent) and M3 (urgent) patients were merged into the same flow with no physical separation, eliminating meaningful prioritization. Interconsultations ran entirely on paper, with no scheduling, no tracking, and no accountability.
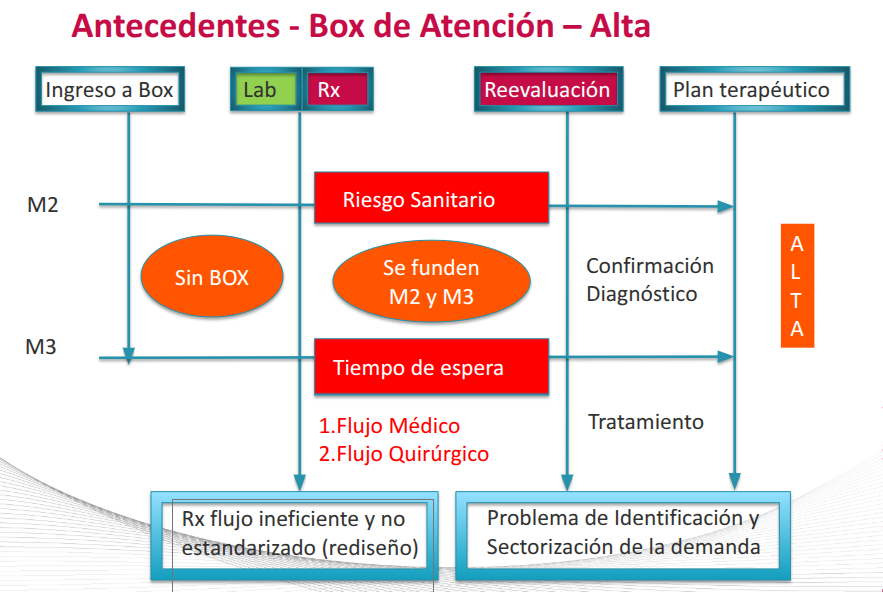
The bottleneck wasn't clinical. It was the coordination layer between clinical units. Each unit was functioning reasonably well in isolation. The system was failing at the handoffs between them.
Cardiology: diagnosing the right problem
Cardiology represented 32% of bed usage among high-stay pathologies, with an average stay of 6.2 days. The standard assumption: long stays were driven by complex cases.
When I analyzed the data, that wasn't what was happening. The real driver was what I started calling the "grey zone": patients with ambiguous presentations — borderline ECG, a single elevated troponin, no confirmed diagnosis. These patients sat in limbo because existing protocols were designed for clear-cut cases. Nobody had designed a pathway for uncertainty.
Identifying the grey zone as the actual bottleneck — not the complex cases everyone assumed — changed what needed to be designed.
Solution design
The solution intervened across three layers simultaneously — physical infrastructure, digital systems, and clinical protocols. These had to move in parallel because changing one without the others would have recreated the same bottleneck in a different place.
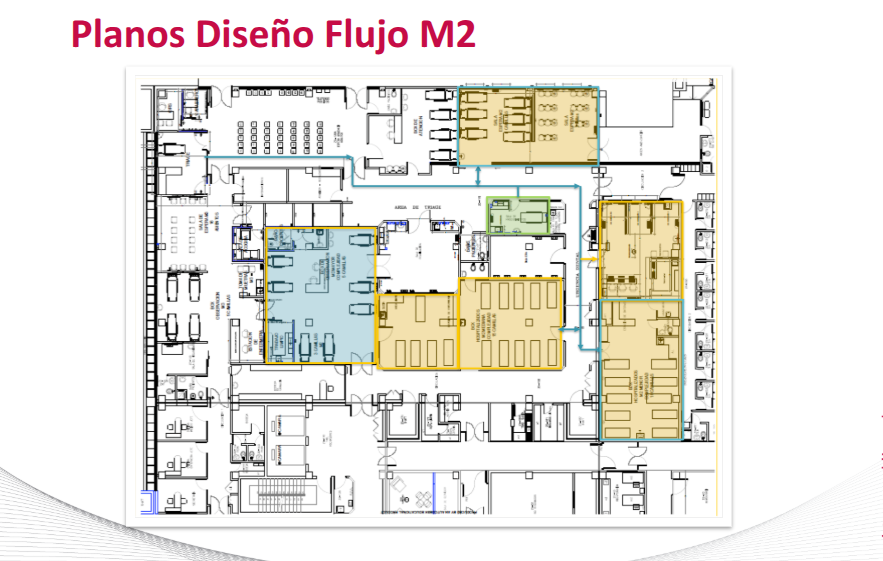
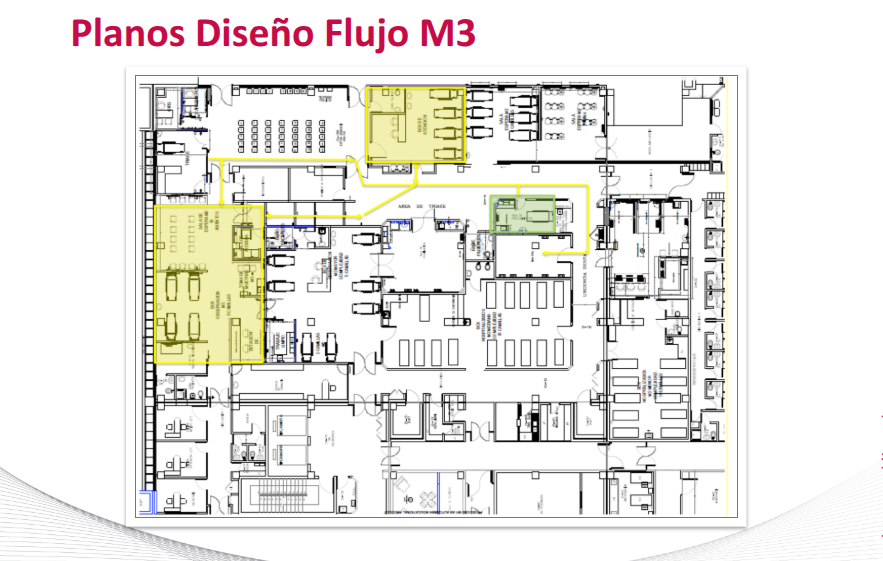
1. Split Flow — separating patient streams
The core structural change: physically separating M2 and M3 patient flows, each with dedicated waiting areas, treatment rooms, and hospitalization boxes. This eliminated the merging that had been killing prioritization. The redesign required architectural changes — new layout approved by hospital professionals, physical works initiated April 2017.
2. Diagnostic support flows
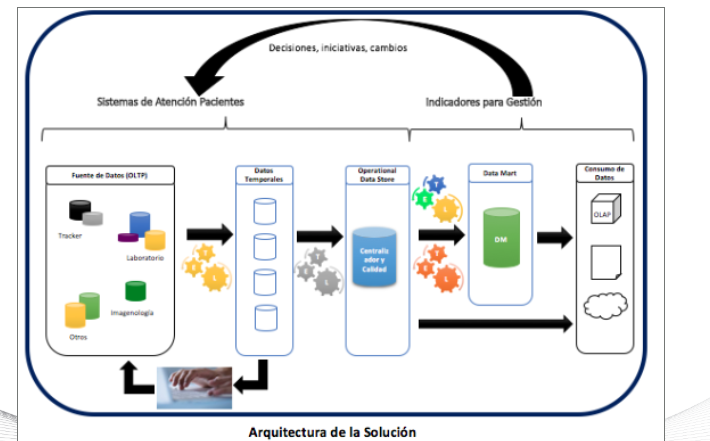
Lab and imaging were redesigned around the new layout: electronic medical orders replacing paper, pneumatic sample transport system relocated, TrakCare↔RIS integration for imaging, and alert systems for critical results. Goal: eliminate the 6.42-hour A1→A2 gap by removing coordination friction between clinical decision and result delivery.
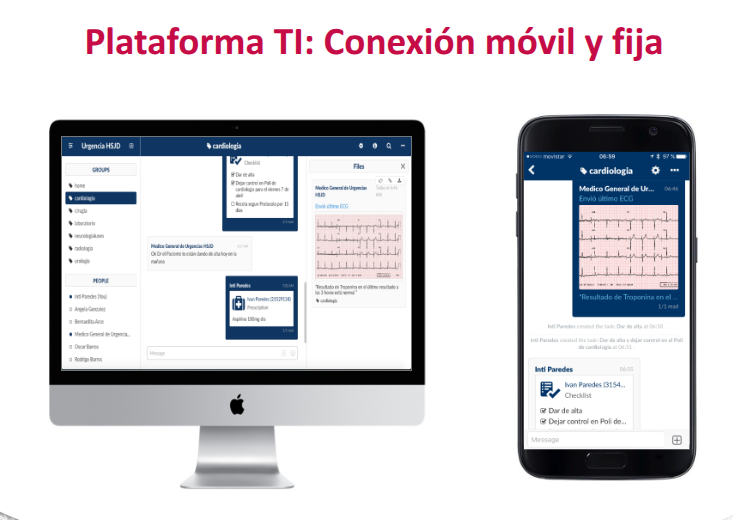
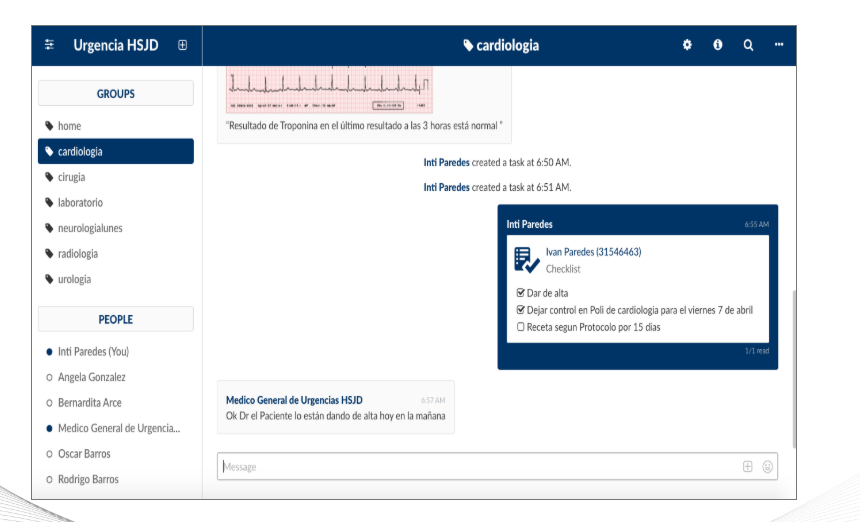
3. Interconsultation — from paper to system
The paper-based interconsultation system was replaced entirely. We also prototyped Stitch HealthCoordination — a mobile tool allowing specialists to review interconsultations, send exam results, provide instructions, and activate discharge protocols from their phone.

4. Cardiology protocol for the grey zone
Instead of a generic protocol, we designed specifically for ambiguous presentations: standardized pre-specialist workup, binding clinical variables, explicit discharge criteria (normal ECG + two normal troponins + normal echo), 15-day discharge prescription, and confirmed ambulatory follow-up at 3 days. The protocol didn't try to eliminate uncertainty — it created a structured pathway through it.
5. A metric that didn't exist
No standard KPI existed for what we needed to measure: a shift's capacity to resolve patients rather than accumulate them. We designed the "Production Factor": resolved admissions minus pending admissions, over total admissions. Range: −1 to +1. A positive score means the shift resolved more than it deferred. Defining the right metric before measuring is the difference between managing a system and managing a number.
Stakeholders and change management
The stakeholder map was extensive: hospital director, deputy directors, head of emergency, head nurse, medical team, nurses, bed managers, social workers, imaging technologists, administrative staff.
In clinical environments, change doesn't succeed because a consultant recommends it. It succeeds when someone with internal credibility owns it. My champion was Dr. Rodrigo Riffo, Head of Emergency at HSJD. He understood the system diagnosis, believed in the direction, and did the work of buy-in with the medical team — particularly the more skeptical physicians.
The fact that we arrived with measured data — times I had recorded personally on the floor, occupancy patterns from camera footage, TrakCare analysis — made the diagnosis hard to argue with. The winter campaign peak made the urgency undeniable.
Results
- Cardiac average stay: 6.2 → 1.3 days — 79% reduction, driven by the grey zone protocol.
- Total ED wait times: −49% — measured from baseline across patient categories.
- Interconsultation system: fully digital — paper eliminated, specialist response times tracked.
- Split flow: implemented — physical works completed April 2017.
Recognition
Reflection
This project shaped how I think about complex service environments. The most important lesson: go to the floor. The most important data came from direct observation — timing patients manually, watching box occupancy from camera footage, mapping flows by walking them. No dashboard would have shown us the grey zone problem.
The bottleneck is usually in the coordination layer, not the units themselves. Each clinical unit was functioning reasonably well in isolation. The system was failing at the handoffs — that's true in most complex service environments, clinical or otherwise.
What I'd do differently: change in high-stakes environments requires an internal champion, not just a good diagnosis. My role was to build the evidence and design the solution. Dr. Riffo's role was to make it land. Both were necessary. Knowing which role you're playing — and which role you need someone else to play — is a judgment call that doesn't show up in any framework. I'd be more deliberate about identifying and investing in that relationship earlier.